Saturday 23 September 2006

let's get modal

Note: The RichText blog has moved to www.ricroberts.com

UPDATE 12 July 07: Check out this more recent post for more info on modal dialogs.

In the Ruby On Rails project on which I'm currently working, I felt the need to introduce the concept of a modal dialog box. This is a common requirement in traditional client-applications, in order to restrict a user's actions to a certain area of the screen. However, until the advent of Web 2.0 it has been tricky implement in internet-based applications.

I tried a few different approaches, but finally settled on using the Xilinus Prototype Window javascript libraries to help me out.

A bit of background...

In my project, I orginally had a table which contained links to allow the user to edit the (often complex) contents of some of the table-cells. The links would causethe user to be navigated away from the page, and so after they had finished doing their editing they would have to navigate back. This is all very well, apart from the fact that if we wanted the site to remember other values that the user had entered on the first page, it meant storing hoards of things in the session. I stuck with this approach for a while, but the more functionality I added to the page, the more work I had to put into maintaining state in the session. Something had to change!

My solution

1. First download the Prototype Window libraries from here. (I used version 0.96.2).

2. The download zip-file contains a bunch of folders. Put the window.js file from the javascripts folder into your rails project's public/javascripts folder. (You will also need the prototype.js file, but this should already be there for you if you generated your project from a skeleton). The stylesheets folder in the zip-file contains all the different themes that are demonstrated on the xilinus prototype window samples page. The styles that you want to use need to go into your rails project's public/stylesheets folder. (I made a window subfolder to keep things tidier).

3. So that your views can use the prototype window javascript, put a javascript include tag in the head of the appropriate layouts file. For the sake of this example, put it in the application.rhtml layout file.

<%= javascript_include_tag "prototype", "effects", "window" %>
Also put in a stylesheet link to the style of modal dialog log you want.
<%= stylesheet_link_tag "/stylesheets/window/default" %>
We're going to use some javascript later, so put a content_for_page_scripts tag in the head of the layout too.
<script type="text/javascript"><%=@content_for_page_scripts %></script> 

4. In the view from which you wish to launch the modal dialog, we need some javascript. Write a function, and put it inside a content_for page_scripts block. Here, the function launches a modal dialog containing the web page at the url passed in.
<% content_for("page_scripts") do -%>

function show_Array_Window(myUrl)
{
  win = new Window('window_id', {title: "Array", width:300, height:500, url:myUrl});
  win.setDestroyOnClose();
  win.showCenter();
}

<% end -%>

5. Now set up a link for the user to click on, and set the onclick event to the function we just wrote. In the example below, we're building up a table with a link to a different object in each row's cell. (If you just want a permanent link to a single modal dialog, you dont need to go to the trouble of building up a dynamic onclick string).
<table>
  <% for i in 0...@my_array.length do %>
    <tr>
      <td>
        <%=
          # other code here if you like
          "<a href = \"#\" onclick='show_Array_Window(
\"" + url_for(:controller => 'my_controller',
:action => 'my_Action', :id => i) + "\")'>
Go Modal!</a>"
        %>
      </td>
    </tr>
  <% end %>
</table>

6. You can now do whatever you want in the page that's shown. In my case, this involved allowing the user to edit the complex data structure that was represented by the object in the table.

... and that's it.

The advantage of using the Xilinus Prototype Window libraries over other modal dialog approaches like lightbox gone wild is that because you just point the dialog to a url, the page that is shown inside can include its own javascript. This allows you to do ajax stuff inside your dialog like it was any other rails page. (I wont go into the whole ajax thing here).


Digg Technorati del.icio.us Stumbleupon Reddit Blinklist Furl Spurl Yahoo Simpy

Please also visit the Swirrl blog

Wednesday 20 September 2006

Update on debugging in RadRails

Note: The RichText blog has moved to www.ricroberts.com

In my last post I described how to get Rails debugging to work in RadRails. I've had some reaction to my instructions, and on the whole they seem OK.

However, I don't think I made it clear that you need to set the breakpoints before you start the server.

Also, someone said they couldn't get it to work with older versions of Ruby and RadRails - so make sure you're fully up to date!

Any more feedback appreciated.


Digg Technorati del.icio.us Stumbleupon Reddit Blinklist Furl Spurl Yahoo Simpy

Please also visit the Swirrl blog

Tuesday 19 September 2006

RadRails, all is forgiven!

Note: The RichText blog has moved to www.ricroberts.com

UPDATE 9 March 2007: If you're using a Mac, you might want to try TextMate with ruby-debug. See these more recent posts:
Fast Ruby Debugging
TextMate for Rails

UPDATE 7 May 2007: Aptana (formerly Radrails) now supports fast debugging. See this recent post: Aptana with fast debugging

UPDATE 12 Sep 2007: NetBeans is another debugging solution I've recently discovered (and one I'd heartily recommend trying).

In August, I made a couple of posts (RoR debugging, Gleaming Steel) regarding Ruby on Rails IDEs and debugging. Since then I've come across something which made me realise I hadn't been giving Radrails its due praise.

While browsing the RadRails community pages for news of any updates, I found a link to this article by Steve Midgley which explains how to set up Eclipse for inline debugging with Rails. Steve was using something called EasyEclipse, but RadRails is based on Eclipse so I gave his instructions a go, and hey-presto!... rails debugging.

It's a bit slow, but no slower than RubyInSteel or Komodo. I think the RadRails team should make more of an effort to publicise their app's ability to debug rails code, as other products make a big deal of this feature. (apparently "fast debugging" is coming in version 0.8 of RadRails).

Steve's instructions, although very informative, are quite "wordy" and somewhat oriented towards EasyEclipse - so I thought I would write my own instructions specifically for RadRails with some screenshots. (click on the screenshots to zoom in).

(I'm using RadRails 0.7.1 with Ruby 1.8.5 and Rails 1.1.6 on Windows XP SP2.). I've also got debugging going in Mac OS X see this post.

1. First, get your installation of RadRails set up properly (here are some good instructions for this).

2. Set a breakpoint somewhere (such as a controller method) by double clicking in the margin.

2. Open your rails project, and have the Rails Navigator View open. Go to the Run menu and choose 'Debug...'


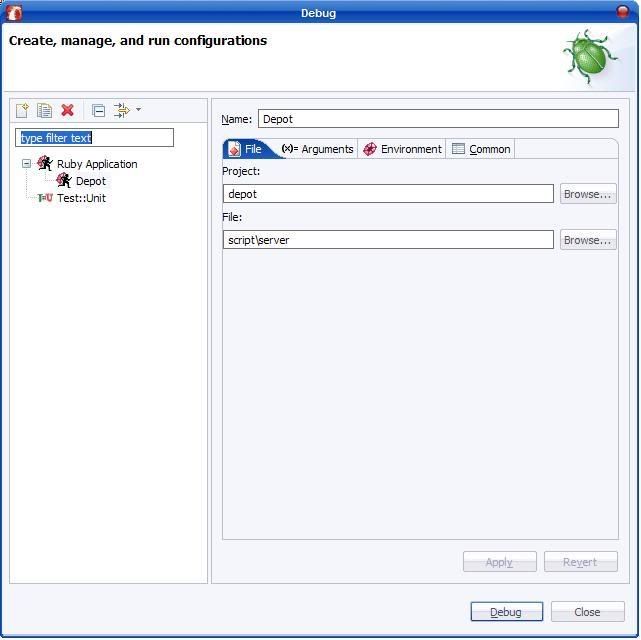
3. You will be presented with the Debug dialog. Make a new configuration for your project and on the File tab, specify the file as script/server.


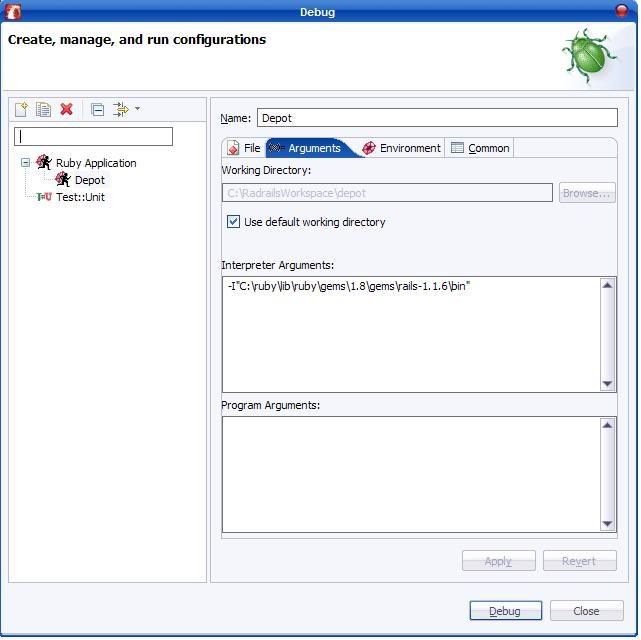
4. On the Arguments tab, enter -I"[path_to_rails]", like in the example below. (There is no space between the -I and the path). You can also specify program arguments too if you like, such as which port to start on (not shown below).


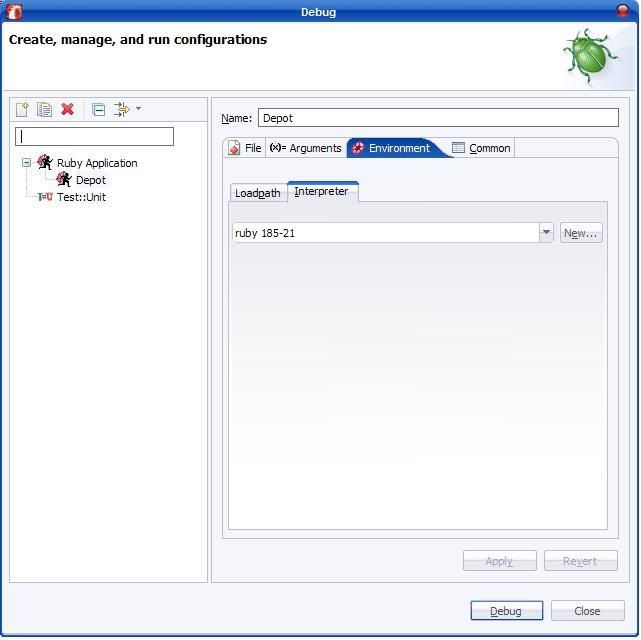
5. On the Environment tab, select your ruby interpreter.


6. On the Common tab, ensure that the "Allocate Console" checkbox is checked, and the "Launch In background" checkbox is unchecked.


7. Click Apply to apply all your changes. Clicking "Debug" should start the debugger. After a short wait, You should see something like the screenshot below in your RadRails Console window. If not, review the steps above as you've gone wrong somewhere.

8. Now open a browser and navigate to the relevant page to trigger your controller method.

9. (This step was updated 20th Nov 2006) Go to the Debug Perspective (Window -> Open perspective... ). You should see execution stopped at your breakpoint. You are now able to step in/out/over. You can inspect variables by highlighting a variable currently in scope, right clicking and choosing inspect. The variable will appear in the Expressions window (I think this shows in the top-right of the Debug Perspective by default).


To debug again later, you can simply go to Run -> Debug History, and choose the name of the debug configuration you set up earlier.

All of this is essentially the same idea as setting up debugging in RubyInSteel or Komodo, so I knew it must be possible somehow, I just couldn't figure out the configuration options - my thanks go out to Steve Midgley!


Digg Technorati del.icio.us Stumbleupon Reddit Blinklist Furl Spurl Yahoo Simpy

Please also visit the Swirrl blog