UPDATE 9 March 2007: If you're using a Mac, you might want to try TextMate with ruby-debug. See these more recent posts:
Fast Ruby Debugging
TextMate for Rails
UPDATE 7 May 2007: Aptana (formerly Radrails) now supports fast debugging. See this recent post: Aptana with fast debugging
UPDATE 12 Sep 2007: NetBeans is another debugging solution I've recently discovered (and one I'd heartily recommend trying).
In August, I made a couple of posts (RoR debugging, Gleaming Steel) regarding Ruby on Rails IDEs and debugging. Since then I've come across something which made me realise I hadn't been giving Radrails its due praise.
While browsing the RadRails community pages for news of any updates, I found a link to this article by Steve Midgley which explains how to set up Eclipse for inline debugging with Rails. Steve was using something called EasyEclipse, but RadRails is based on Eclipse so I gave his instructions a go, and hey-presto!... rails debugging.
It's a bit slow, but no slower than RubyInSteel or Komodo. I think the RadRails team should make more of an effort to publicise their app's ability to debug rails code, as other products make a big deal of this feature. (apparently "fast debugging" is coming in version 0.8 of RadRails).
Steve's instructions, although very informative, are quite "wordy" and somewhat oriented towards EasyEclipse - so I thought I would write my own instructions specifically for RadRails with some screenshots. (click on the screenshots to zoom in).
(I'm using RadRails 0.7.1 with Ruby 1.8.5 and Rails 1.1.6 on Windows XP SP2.). I've also got debugging going in Mac OS X see this post.
1. First, get your installation of RadRails set up properly (here are some good instructions for this).
2. Set a breakpoint somewhere (such as a controller method) by double clicking in the margin.
2. Open your rails project, and have the Rails Navigator View open. Go to the Run menu and choose 'Debug...'

3. You will be presented with the Debug dialog. Make a new configuration for your project and on the File tab, specify the file as script/server.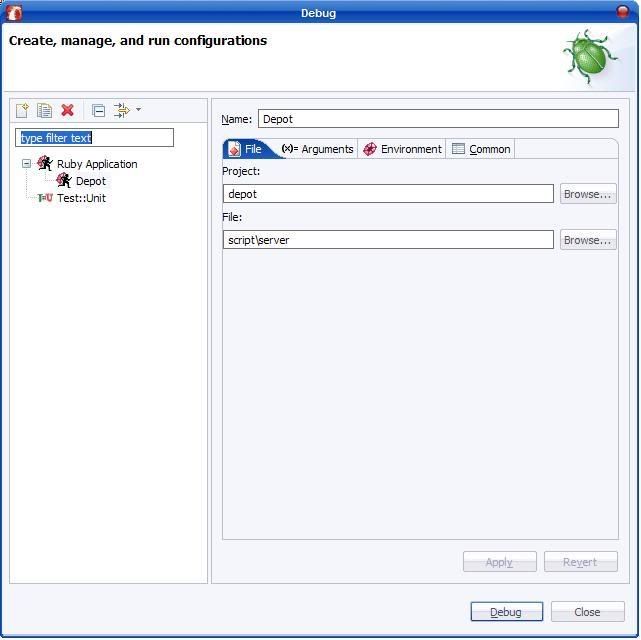
4. On the Arguments tab, enter -I"[path_to_rails]", like in the example below. (There is no space between the -I and the path). You can also specify program arguments too if you like, such as which port to start on (not shown below).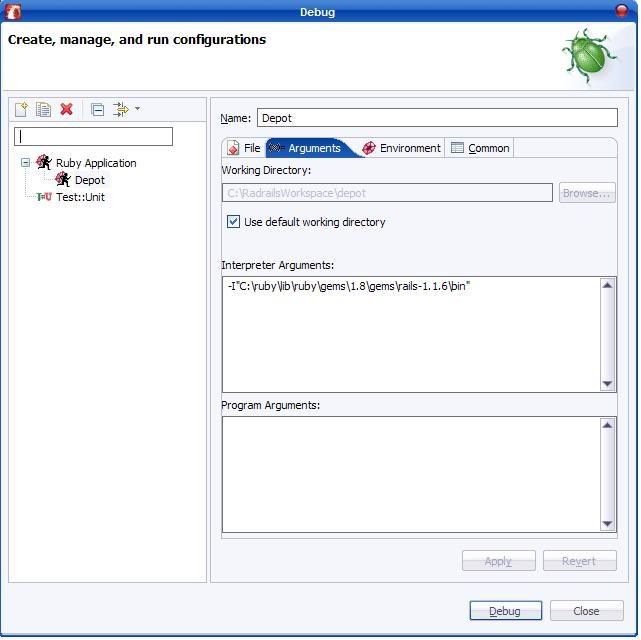
5. On the Environment tab, select your ruby interpreter.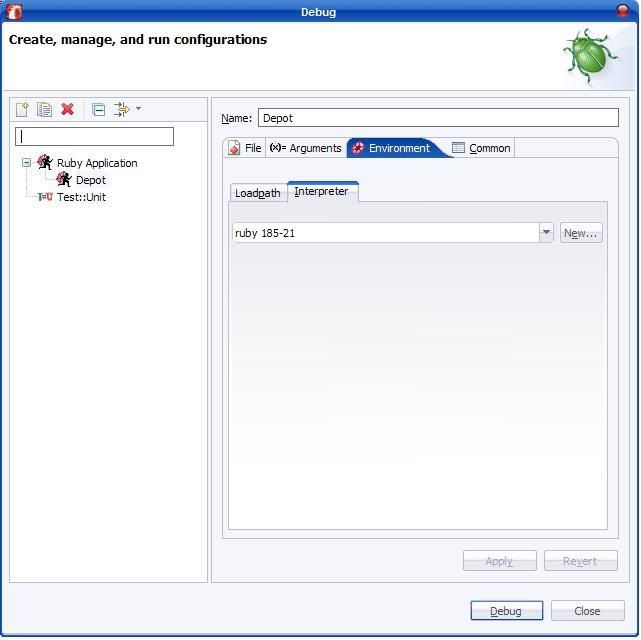
6. On the Common tab, ensure that the "Allocate Console" checkbox is checked, and the "Launch In background" checkbox is unchecked.
7. Click Apply to apply all your changes. Clicking "Debug" should start the debugger. After a short wait, You should see something like the screenshot below in your RadRails Console window. If not, review the steps above as you've gone wrong somewhere.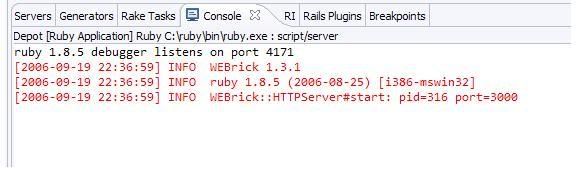 8. Now open a browser and navigate to the relevant page to trigger your controller method.
9. (This step was updated 20th Nov 2006) Go to the Debug Perspective (Window -> Open perspective... ). You should see execution stopped at your breakpoint. You are now able to step in/out/over. You can inspect variables by highlighting a variable currently in scope, right clicking and choosing inspect. The variable will appear in the Expressions window (I think this shows in the top-right of the Debug Perspective by default). 
To debug again later, you can simply go to Run -> Debug History, and choose the name of the debug configuration you set up earlier.
All of this is essentially the same idea as setting up debugging in RubyInSteel or Komodo, so I knew it must be possible somehow, I just couldn't figure out the configuration options - my thanks go out to Steve Midgley!


34 comments:
Thanks for tip, but didnt' work for me. I'm using WinXP on Ruby 1.8.4 and Rails 1.1.6. First, I couldn't see the Debug... menu item in the Rails Perspective. I was able to bring it up in the Debug perspective. I filled out the Debug configuration and ran. It started, but I got an error message:
ruby 1.8.4 debugger listens on port 1266
This application has requested the Runtime to terminate it in an unusual way.
Please contact the application's support team for more information.
Not a big deal. I've been using ruby-debug successfully. I may just have to wait for RadRails 0.8.
Hi Don,
Someone I know had the same problem as you in ruby 1.8.4, and they got it to work by upgrading to ruby 1.8.5. (See the next blog entry).
Cheers,
Rich.
Hi Rich,
quick question, how to define the port in program arguments? Sorry im not so good with it yet.
if you could, may you please provide me with links that explain what arguments i can set there?
THANK YOU!!
To specify the port that the server runs on you need to use the -p argument. For example: -p3001. Check out: http://www.webrick.org/ and the ruby on rails wiki, in particular http://wiki.rubyonrails.org/rails/pages/WEBrick
Hello Rich,
thanks for this post!
However, I am still not able to debug within RadRails maybe somebody had the same problems.
I have WinXP 2 running with Rails 1.1.6 and ruby 1.8.5.
I followed all the instructions and the debugger starts successfully. But after the start there are no variables tracked/listed by the debugger in the “Variables” view and also are the breakpoints without a functionality (yes I put them before I started the server and debugger).
This is how it looks after the debugger starts:
ruby 1.8.5 debugger listens on port 1138
[2006-10-19 15:35:35] INFO WEBrick 1.3.1
[2006-10-19 15:35:35] INFO ruby 1.8.5 (2006-08-25) [i386-mswin32]
[2006-10-19 15:35:35] INFO WEBrick::HTTPServer#start: pid=2780 port=3000
The application is running without problems, just that I connot not use the debugger.
You might be able to give a cue.
Thank You!
Hi rudi.
Just make sure you've got a breakpoint set, and then run something that will hit your breakpoint. Once you've done that, go to the Debug View (Window -> Show View... ). You should see execution stopped at your breakpoint. You are now able to step in/out/over, examine variables etc.
Hope this helps.
Hello Rich,
thank you for the fast answer!
Yes, the breakpoints are setted ( I setted them nearly in every controller, just to be sure) but there is still no debugging functionality. I also enabled the debug views, also the application while working in the browser doesn’t wait for a breakpoint, it is behaving like usually.
Its really strange.
Anyway, I will use the logger function, then I will be at least able to find out the variables and more in this way, instead of using the ruby shell for debugging.
Thanks!
Hey gang,
This is awesome info. I am a ROR noob. So far its awesome... the the curve is steep given my background is straight up Windows shop and C++/C#/Asp and all that shizzle.
Anyway. I tried out these steps and am getting an error as below. I'm guessing its obvious or I am doing something stupid, but any coaching/help would be great. I was concerned that it was choking on the space in the path, but I repro'd it in another non-space project as well.
ruby 1.8.5 debugger listens on port 1930
F:/My Documents/Dev n Tech/RadRails/Myappname/app/controllers/account_controller.rb:1: uninitialized constant ApplicationController (NameError)
Thanks!
Thanks for this. I'm now able to set breakpoints and step through them on my SuSe-based RadRails.
You imply that you can also inspect variables - I wasn't able to to do this. The variables view is empty. Any ideas why?
I don't mean to question what you're seeing, but judging from this comment, the variables view should not be populating in v0.7.1. Any chance of screenshots? I can step through my code, but like many here, can't see variable contents, which is rather useless.
Hello people. Sorry not responded for a while. I think we've got our wires crossed - my fault, I think.
I meant debug "perspective", not "view" (sorry - I'm pretty new to rails). Once you've hit a breakpoint and you go to the debug perspective, you can right click on variables and click "inspect" in the context menu.
Hope this helps. I'll update the blog post.
I got the output.But I don't know the parameters description.Like -I*C:\ruby......*
Can you tell the answer
muralee, I think you're talking about the interpreter arguments.
You need to enter:
-I"[path_to_rails]". Note the quotes rather than askerisks. See the screenshot in the blog post for an example.
Cheers,
Rich.
Hi!
If I am using Mongrel as my server, could it be possible that running the debugger with webrick can cause the error mentioned by don parish?,
"This application has requested the Runtime to terminate it in an unusual way."
I am installing ruby 1.8.5 to see if I can overcome this problem
Thanks
I have intalled ruby 1.8.5 and now the debug session can start correctly but now I am having the same problem as Rudi; the breakpoints are not being hit. I have set the breakpoints, started the server, started the debug session, enabled the debug view and then nothing happened.
If anyone can share any workaround to this problem I would really appreciate it.
Thanks!
I was debugging again last night, and it works fine for me.
Simply set the breakpoint, start the debug server and go to the DEBUG PERSPECTIVE. It takes a while before the breakpoint is hit as currently debugging in Radrails is quite slow.
Hi,
I am using instanrails. What's the argument for -I with Instantrails?
Is it,
D:\InstantRails\ruby\lib\ruby\gems\1.8\gems\rails-1.1.2\bin
or
D:\InstantRails\ruby\bin
Thanks,
Thushan
Hello.
Not 100% sure about instant rails, as I don't use it. Give it a go with each and see what happens!
For people having problems w/ breakpoints not getting hit, make sure you're using the debug perspective in Eclipse.
At first, I thought I was having that same problem, and that the app was "locking up." It turns out, that my breakpoint was "hit" but I could only see that when in debug perspective. In the default Java perspective, I could see the code and the breakpoint, but not the execution.
Hope this helps!
I've got a problem with terminating. Eclipse claims to have terminated the debug instance but it's still running and I have to kill it manually at the command line each time.
I'm using Linux, probably the problem. Can anyone post if they solve this?
Hello caolite. I have the same problem when debugging in Mac OSX, but curiously, not in Windows.
I had the same problem as many others here, I could not see stopped execution.
But if I opened the debug view instead of debug perspective, it worked.
I've got everything set up per these instructions. I'm using Ruby 1.8.5 and I'm using the latest Rails and RadRails.
When I run the debugger everything starts up but the breakpoints are never hit. Any ideas?
hnr.louder, Sorry - not got any more advice, really. You may find some tips in the other comments.
When I follow the steps in the blog post, it works pretty reliably for me.
I got the debugger working for 1.2.1 but boy, is it slow or what? Whats up with that??
It is pretty slow isn't it? But it's better than nothing.
The radrails guys say that "Fast Debugging" should be in Radrails 0.8.
I can start the debugger, and it stop at my given breakpoints, but then I do not see any variables whatsoever. The variables window is just plain empty. Without variables, the debugger is not too useful, so does anyone have an idea?
BTW, I had this problem with the debugger not stopping at my breakpoints, too. The solution was simple - there was another server script running at that address and port. Make sure you do not have such a phantom process running when you step into this problem!
Please look back over the other comments where I have explained how to check out the variables. In fact, I updated the blog post a couple of months ago to include this info.
Thanks, Rich. Your effort is commended. The positive comments here are for you; the negatives are directed squarely at the junk that is RadRails.
This at first seemed to be exactly what I'd wanted, since I am also working in RadRails and had never been able to get anything to debug before. Straight Ruby, yes; Rails, no, because I couldn't figure out what process to debug.
Now that I think of it, it actually makes sense -- since the server is just a process running within RadRails, the server itself is the process we need to point at.
At any rate, I followed the instruction, and after the usual wrangling with Rails, got it to work.
I also experienced the problem with 1.8.4 "requesting to be terminated in an unusual way," but 1.8.4 has never allowed debugging, so I had always reverted to 1.8.2 for debugging before. This was the prompt I needed to upgrade to 1.8.5, and that problem went away.
There are two problems now, though. First, the load time for a Rails page to load can now be measured in MINUTES. It's hard to tell whether the app is hung, or just dead slow.
Second, the debugger only occasionally stops at breakpoints, or if it does stop at them, it doesn't shift focus to the breakpoint. It's impossible to tell whether the app is hung, just dead slow, or whether it's gone to some breakpoint somewhere and just doesn't feel like showing that. (This is what I'd experienced with debugging Ruby apps before; it's not unique to Rails apps.)
So Rich has shown us the right way to go to set up debugging in RadRails. That's a big plus. The big minus is that even when set up right, RadRails just doesn't do debugging very well.
Fair point about the slowness. I've now changed to using Textmate and ruby-debug. See these posts:
http://richtextblog.blogspot.com/2007/03/textmate-for-rails.html
http://richtextblog.blogspot.com/2007/03/fast-ruby-debugging.html
I have an error after clicking "debug". Could anyone help?
[2007-03-20 13:57:53] INFO WEBrick 1.3.1
[2007-03-20 13:57:53] INFO ruby 1.8.5 (2006-08-25) [i386-mswin32]
[2007-03-20 13:57:53] WARN TCPServer Error: Bad file descriptor - bind(2)
Hi all, I'm from Aptana, and we've taken over the RadRails project. radrails.org is down, so please visit http://www.aptana.com for RadRails downloads.
We've published a new build of RadRails based on the RDT nightly. Our next step is automatically configuring ruby-debug. It's a bit rough, but we're working out the edges quickly. Please give it a shot and give us your feedback:
http://www.aptana.com/forums/viewtopic.php?t=1145
Hi,
I’ve set up RadRails in Eclipse as specified in the article, but I always get a java.lang.reflect.InvocationTargetException when launching a debug. Running the same server causes no problems. I’m using webrick, rails 1.2.6, RadRails 1.0.0.2, and ruby 1.8.6.
You might want to try Netbeans instead. It works beautifully.
(I've given up on Radrails/Aptana).
Check out these more recent posts:
http://richtextblog.blogspot.com/2007/09/netbeans-intervenes.html
http://richtextblog.blogspot.com/2008/03/rails-on-mac-os-x-leopard.html
Post a Comment